Howto debug Mendix java actions
January 16, 2014To debug Java Actions used in a Mendix Microflow you need to make some configuration changes to the way you start the Mendix runtime.
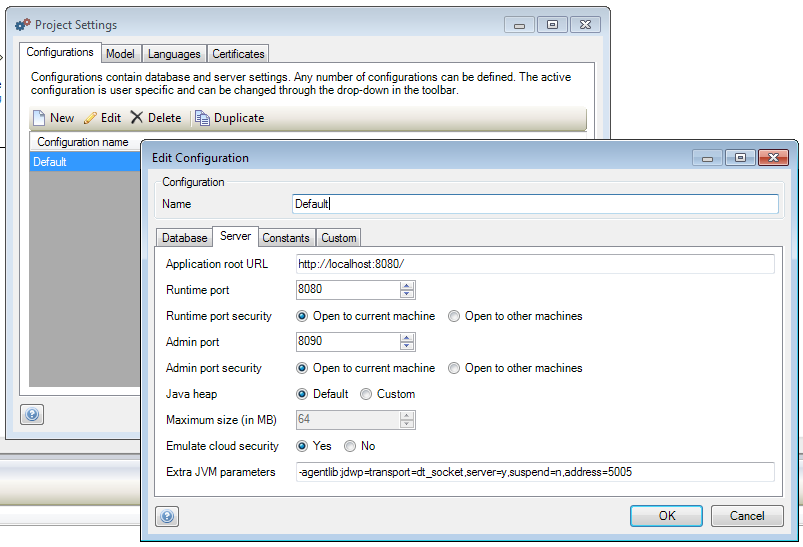
Add the following in your project settings, in server configuration add the following to Extra JVM parameters:
-agentlib:jdwp=transport=dt_socket,server=y,suspend=n,address=5005
Start your application in Mendix.
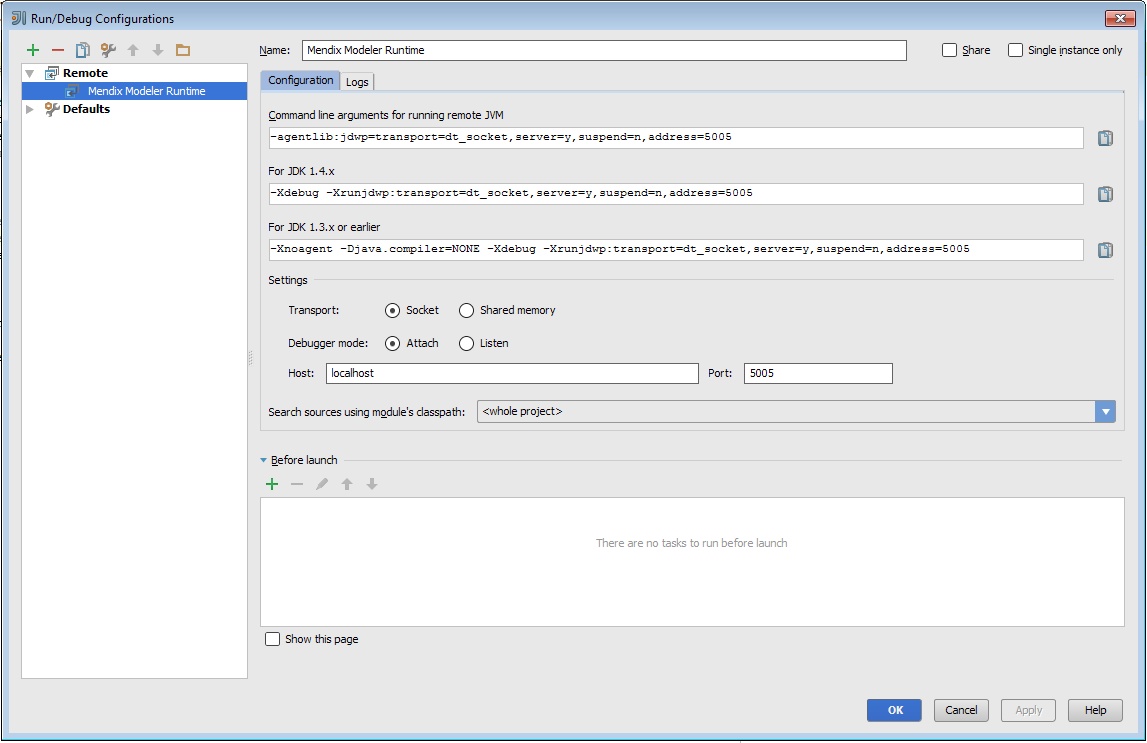
In your Java IDE you need to configure remote debugging. The following screenshot shows my configuration in IntelliJ
Start the debugger, put some breakpoints in your java code, and start debugging.
Profiling Mendix using JProfiler
January 15, 2014JProfiler is a Java profiler which can give you insight into what a running application is doing: which methods are consuming the most cpu, how many objects are created, etc. Jprofiler also shows you information about jdbc calls and sql statements executed by your java application.
Setting up Jprofiler to profile a Mendix runtime is easy, you can start profiling a running Mendix runtime, without reconfiguration or restarting the application.
The installation guide provides a more complete manual, but the basic steps are:
- download and install Jprofiler on a desktop, this will be the client gui
- download and unzip Jprofiler on your server, start bin/jpenable (see see section B.3.10 Attaching To JVM of the manual)
- Start the client on your desktop, connect to a remote server on the port indicated by jpenable
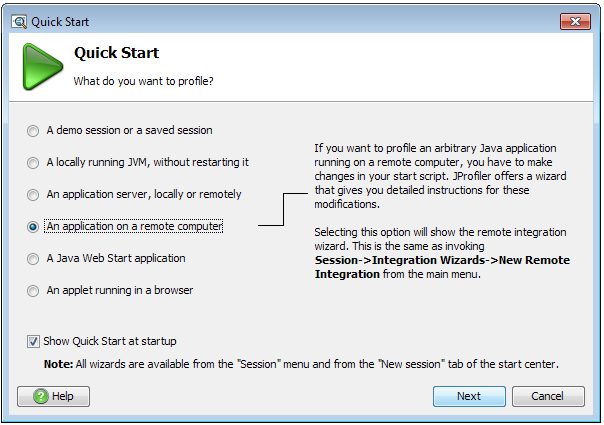
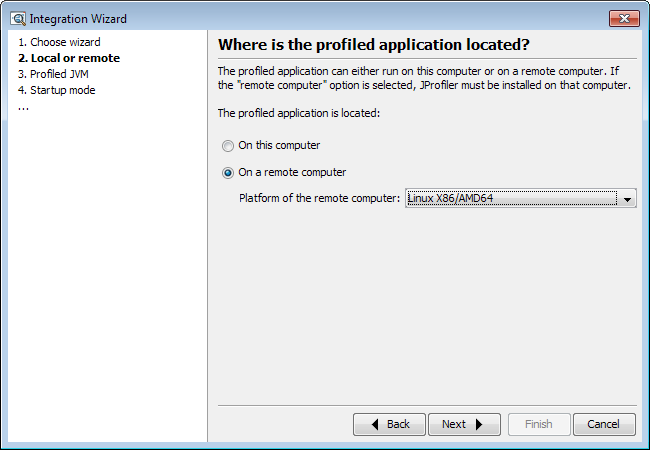
Here are some screenshots:
- Choose to profile an application on a remote server
- My Mendix application is running in a virtual machine running Linux
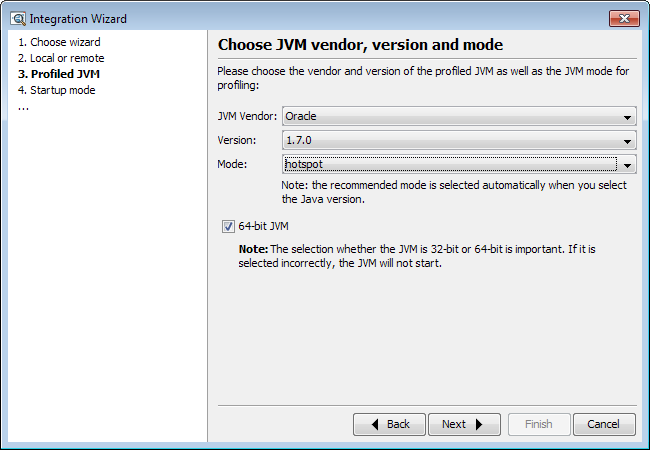
- Choose which Java you are using
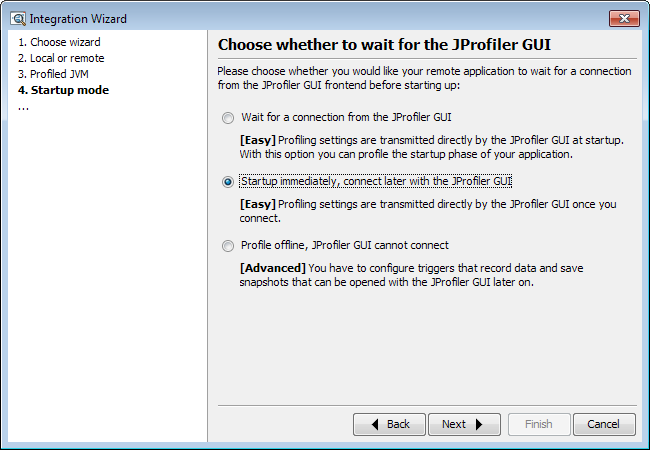
- I’ve already started the Mendix runtime
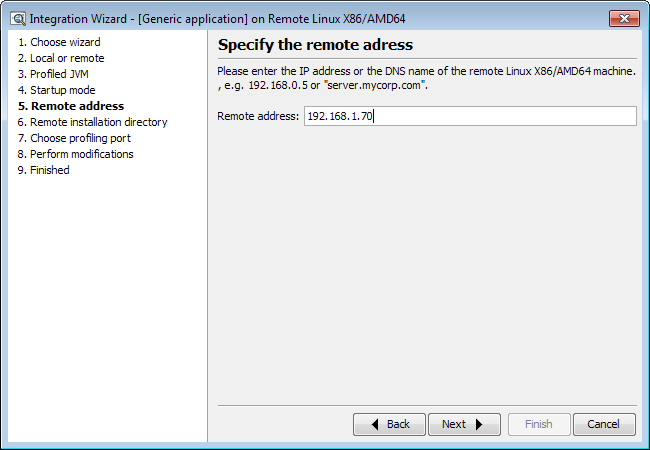
- IP Address of my virtual machine
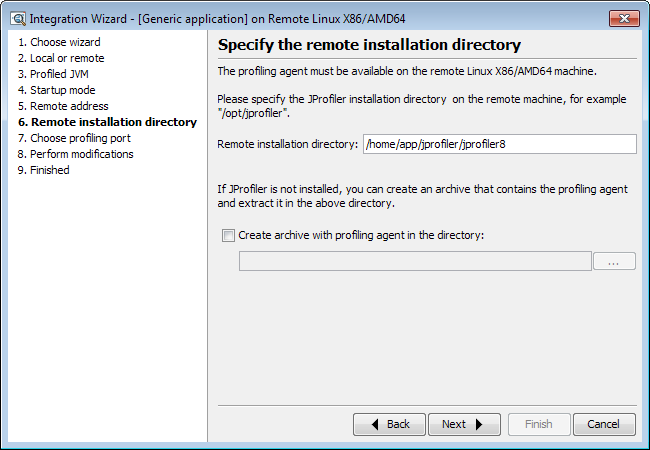
- Directory in the virtual machine where i unzipped Jprofiler
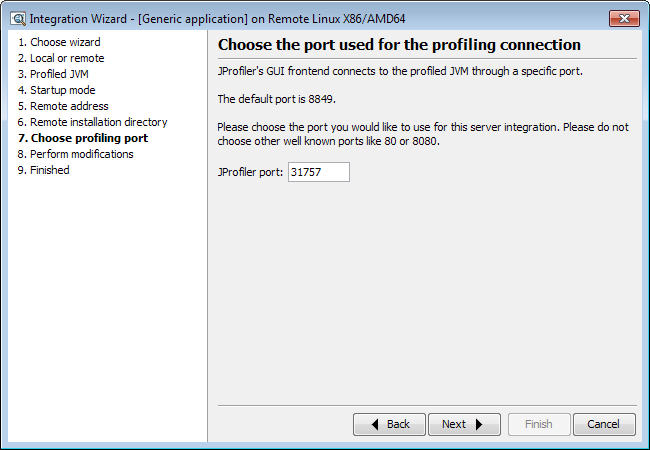
- This is the port returned by running bin/jpenable
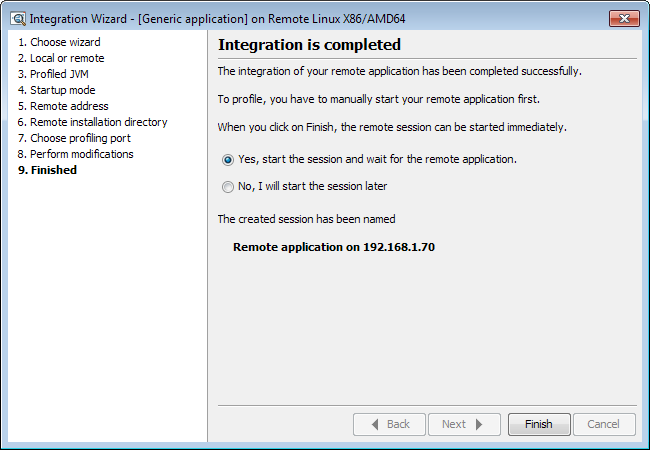
- Start
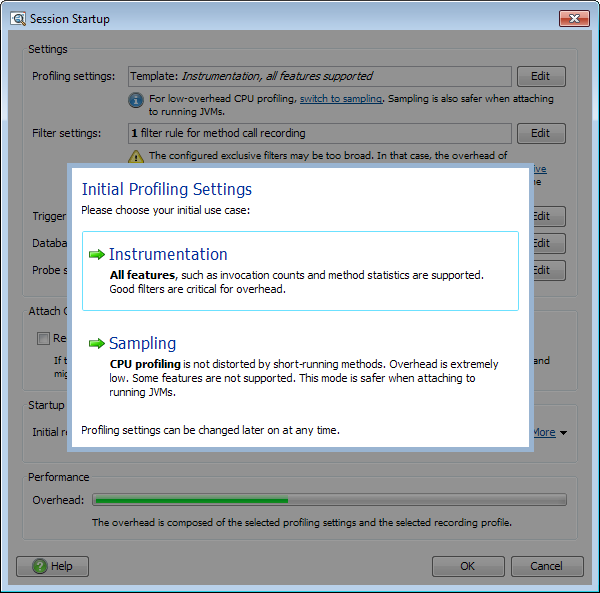
- Choose how you want Jprofiler to collect information about your application
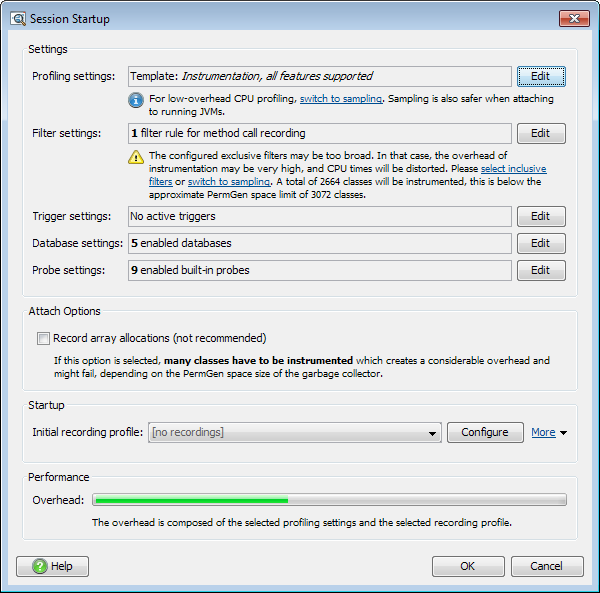
- This is just default setup
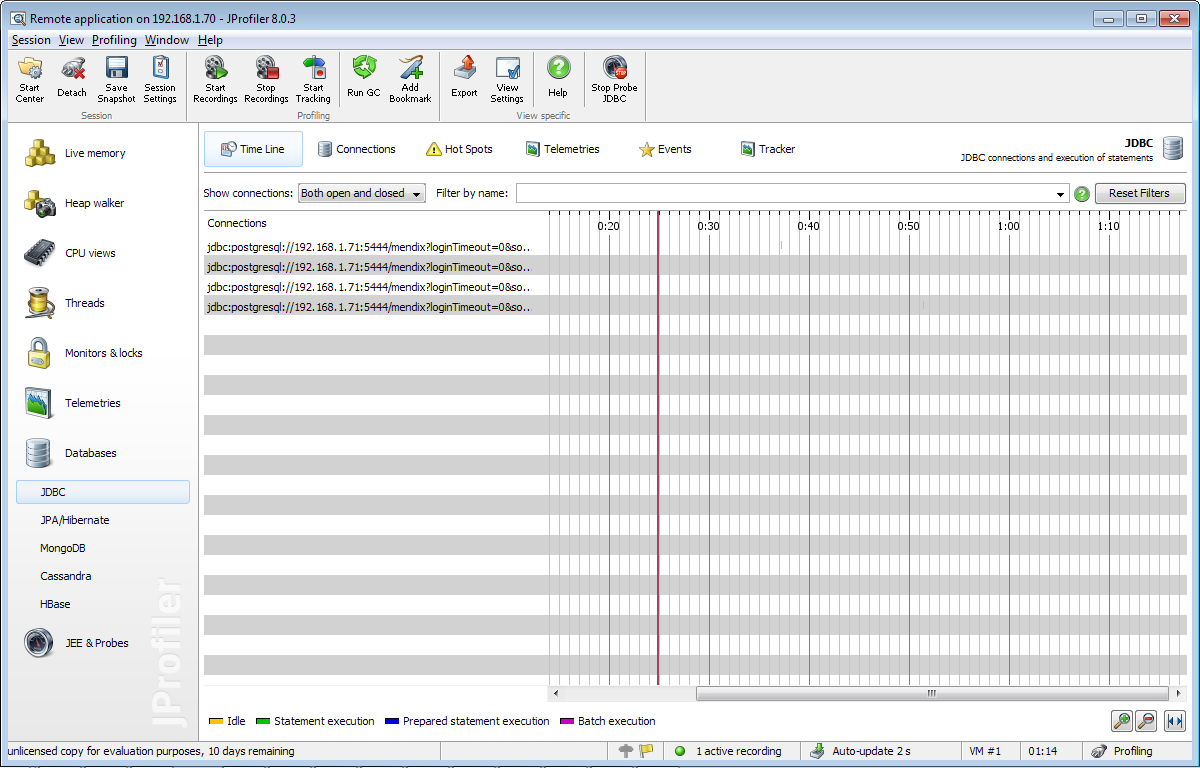
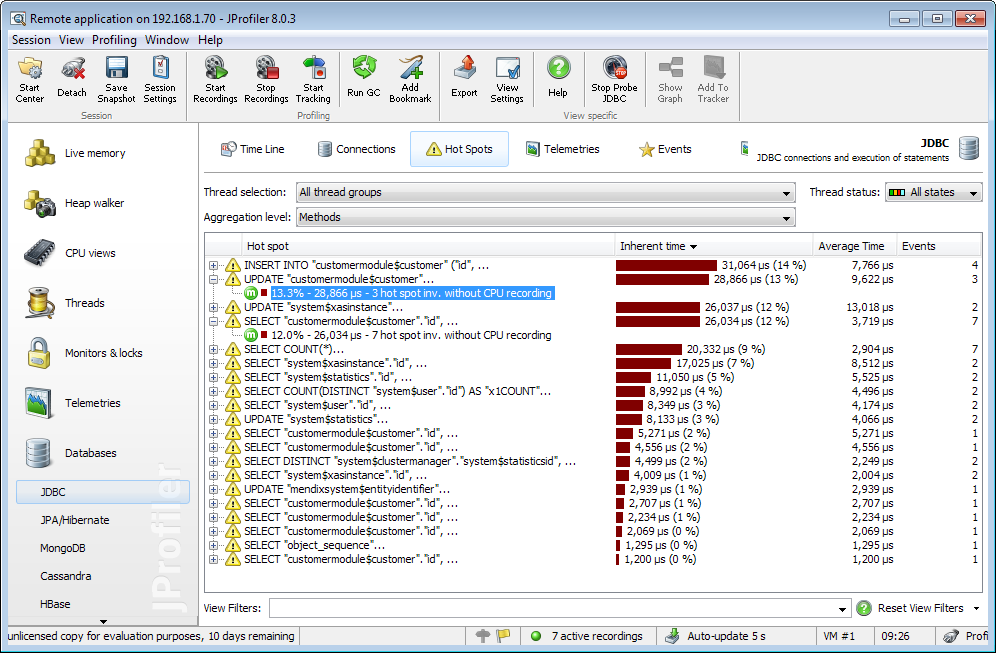
- And finally where looking at some data collected by Jprofiler
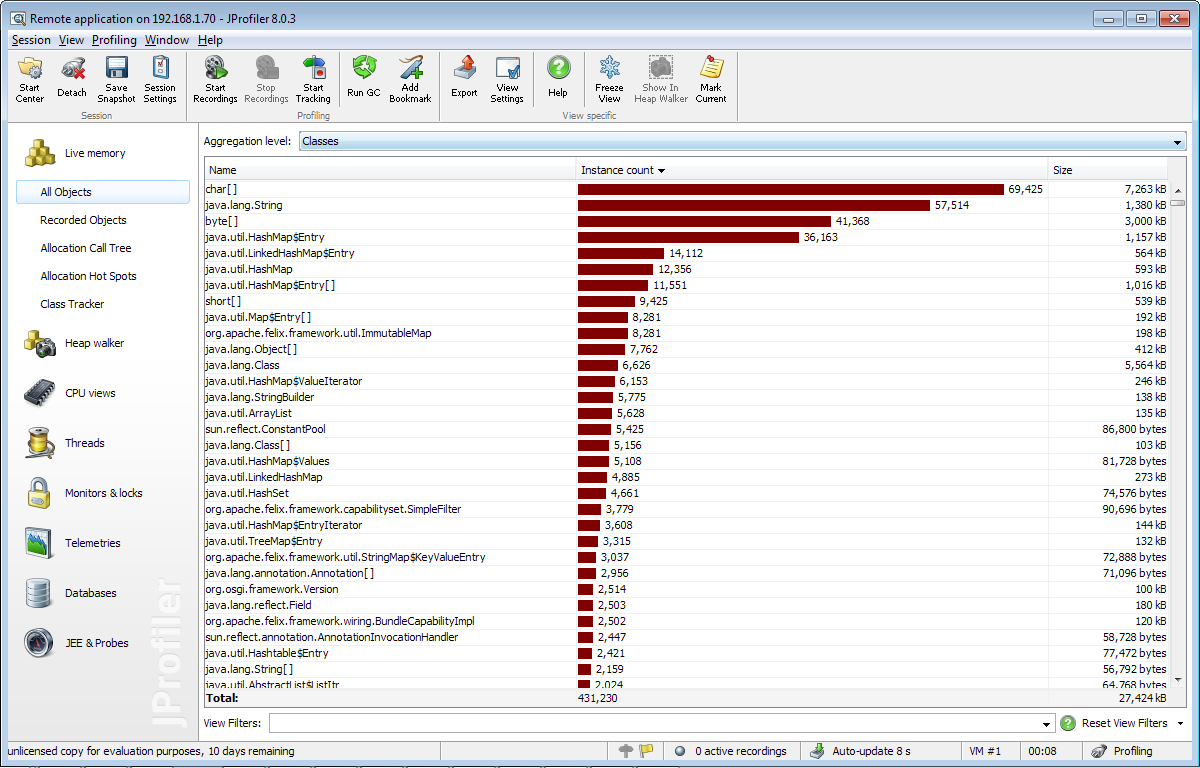
- I currently have 4 database connections
- JDBC Hotspots shows the heaviest SQL statements
Dynamische Architectuur Visualisaties
November 30, 2013Tijdens het LAC-2013 heb ik een presentatie verzorgd over Dynamische Architectuur Visualisatie. Tijdens deze presentatie heb ik laten zien hoe ik schetsen in SVG formaat gebruik als visuele ondersteuning van een presentatie. De svg versie van deze presentatie zie je hieronder. De volgende pagina biedt de mogelijkheid om slides van de presentatie te bookmarken, of the mailen: Dynamische Architectuur Visualisatie. Source code van de library staat op github: Inkscape presenter.